
This variance calculator and simulator for poker is handy and easy to use. Just enter your winrate, standard deviation and the number of hands to simulate. You’ll most certainly get insightful results. Read below how to use this simulator.
20 samples and confidence intervals
Variance in numbers
Detailed sample with downswings
Downswings in numbers
» Great overview: Check out the best High-roller casinos.
Through online simulation, you can get a clearer understanding of the poker results. In offline games, chips are one of the three basic elements of Texas Hold’em. The Custom Poker Chips used in poker clubs or casino poker rooms are clearly marked.
For easy distinction, the face value of the chips is usually printed in bold, and each custom chip may also be printed with the name of the casino or club. In private games, players also have their own set of custom chips.

How to use my Poker Variance Calculator?
This section will explain how the calculator works and what the numbers and charts mean.
Enter the data
Hop over to the Variance Calculator page and enter your win rate, standard deviation, and the number of hands you want to simulate. You can ignore the field observed win rate, we’ll get to its purpose later. Once you have entered the data, hit Calculate and let the Calculator do its magic.
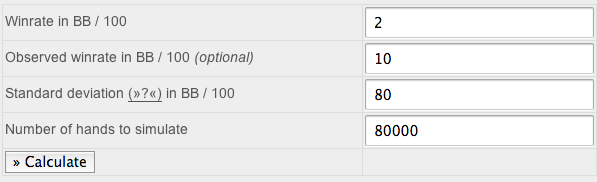
Twenty samples
The first thing the Variance Calculator does is to run 20 samples over the number of hands, win rate and standard deviation specified. It’ll also calculate the expected winnings over the number of hands. This number will appear as a rather boring straight and black line in the graph. Thirdly the calculator displays the 70% and 95% confidence intervals as light and dark green curves. What you need to know about them is that at any given time your winnings will be within these intervals with a probability of 70% and 95% respectively. They basically show, how much variance you should expect to see.
Variance in numbers
Below the first chart, the Variance Calculator compiles a neat list of additional information:
- EV: win rate entered above
- Standard deviation: standard deviation entered above
- Hands: number of hands entered above
- Expected winnings: estimated winnings over the simulated amount of hands
- Standard deviation after X hands: This number shows how much your actual results will differ from the expected results on average. The first number shows the absolute value and the second translates this number into BB/100, showing the impact on your win rate.
- 70% confidence interval: Your actual results over the simulated amount of hands will be within this interval 70% of the time. The first interval shows absolute numbers and the second translates those into BB/100, showing the 70% confidence interval for your win rate.
- 95% confidence interval: Same as the above with 95% certainty. Meaning: 19 out of 20 times your actual winnings will be within this interval.
- Probability of loss after X hands: the probability that you will experience negative winnings (meaning: losses) over the number of hands.
- Probability of running at or above observed win rate …: If you entered an observed win rate, this number will show you the probability that you will experience a run at or above this win rate over the number of hands.
- Probability of running below observed win rate …: Same as above – the probability that you will experience a run below the observed win rate over the number of hands.
- Minimum bankroll for less than 5% risk of ruin: the bankroll needed to have a risk of ruin of less than 5%
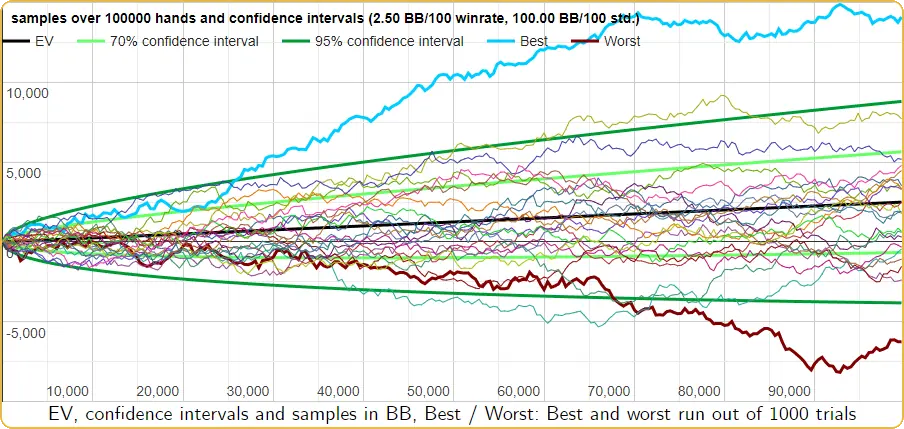
Detailed sample with downswing
This chart simulates a single run over 100 thousand up to 10 million hands with the win rate and standard deviation entered above. You can choose how many hands to simulate by moving the slider.
Apart from showing a single sample, this graph also shows some insightful information about downswings. The red area shows for any given point, how much the sample is currently away from its previous peak, meaning it tracks downswings. This chart uses two vertical axes. While the sample winnings have their scale on the right axis, the downswing tracker has its scale on the left axis. In this example, the simulated player ended up with winnings over 25,000 big blinds after 2.5 million hands but had to deal with a nasty downswing of almost 10,000 big blinds between hand 1.2 million and hand 2 million.
Downswings in numbers
The last section of the Variance Calculator sheds some more light on potential downswings. Therefore 100 million hands are simulated and all downswings over this simulation are tracked. The first table shows the extent of the downswings. It shows how often the simulated player was stuck in a downswing of at least X big blinds. For example (1000+ BB – 31.77%) means the player was in the middle of a downswing of at least 1,000 big blinds 31.77 percent of the time.
The second table shows how long downswings last on average. For example (50000+ Hands – 15.81%) means the simulated player was in a downswing over at least 50,000 hands 15.81 percent of the time. For the purpose of these calculations, a downswing is defined as any period where the current total winnings are below the maximum previous total winnings. Meaning, that by this definition a downswing is not over until the player has fully recovered his losses.
In general, these simulations underestimate the extent of downswings, but the numbers should still give you a decent idea of the vastness of downswings you should expect.
Should you have any questions, encounter any errors or have ideas for improvements, please let me know.
Relevant Links
» Tournament Variance Calculator
» Examples and Impacts of Variance in Cash Games
» ICM Calculator
» Online poker casinos in New Zealand: Overview